A report conducted, written, and produced by Eat24. Yes, the same Eat24 that brought you such reports as Porn, What is it Good For?, Life without Facebook and something about a bear’s manhood.
Stallone vs. Schwarzenegger. PlayStation vs. Xbox. Batman vs. Superman. Star Wars vs. Star Trek. These debates are timeless. But none have the passion, the anger, or the sheer number of obnoxious trolls as the debate between Android and iPhone.
It seems like every week/day/month/trimester there’s another raving, energy drink-fueled blog post claiming that iPhone (No, Android) (No, iPhone!!) is better. Well here’s another one.
We put together some interesting (?) facts, data, and wild speculations to finally settle a bet between Ben and Felipe on our dev team.
iPhone or Android: Who eats healthier?
Developers on one side prepare their C++ based insults while the opposing side readies their taunts (your Java is so 1999!). A war is brewing and with the impending release of iPhone 6S (MORE COLORS!!!!!) the battle lines are drawn. Who will come out on top? Who will still be worth billions of dollars?? Who cares???
Let’s fuel this fire.
———————————————————————————————————————–
Category 1:
Who Orders Healthier Items?
We pulled sweet, sweet data from both our Android and iPhone apps looking at user ordering habits from the last few months. What we saw was interesting. Well, not “Holy cow, did that Pterodactyl just shoot lasers from its eyes?” interesting, more like “ooohhhh data” interesting. Over three months we analyzed our filters.

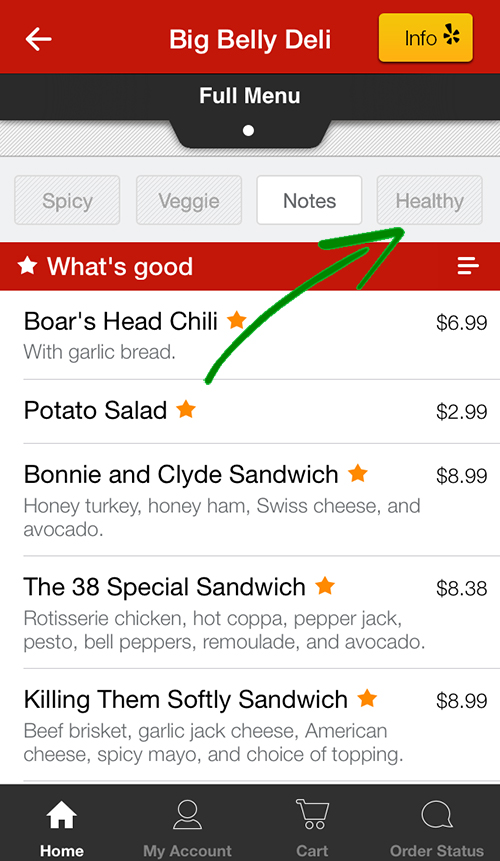
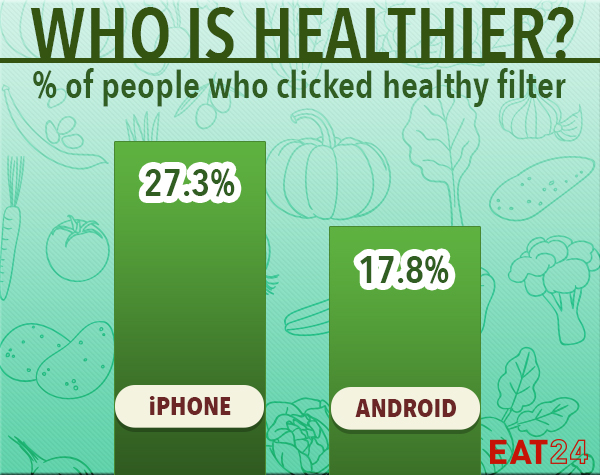
Apparently a whooping 27% of iPhone users clicked “Healthy” before anything else, compared to 17% of Android users. Math might not be our strong suit, but we’re pretty sure this means people who use our app on iOS are 10% more likely to click on “Healthy” than those who use our app on Android. In other words this many:
Even more interestingly, iPhone users clicked and ordered more vegetable based dishes than their robotic-counterparts. In fact they were 7% more likely to order some greens.
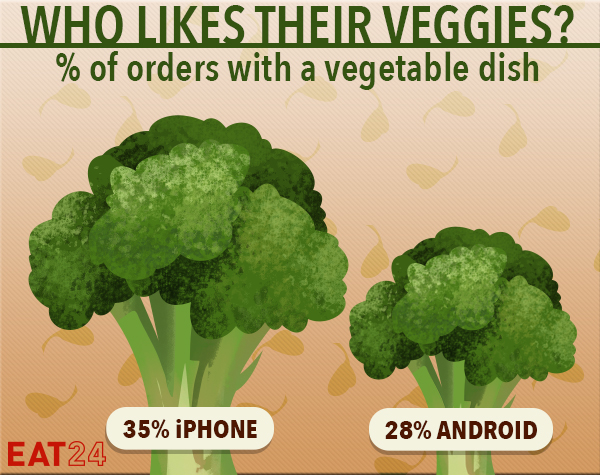
Now we know just because an item is vegetable based doesn’t necessarily mean it’s healthy…

…but clicking our veggie filter at the very least means someone was thinking, hey I’ve been eating nothing but cheese, pork belly and soda for three days, I should probably eat something green.
Also, it appears that while our Android friends might not care so much about calories, they do care for burning things. Android users are 10% more likely to order something spicy. Does this mean Android owners like to live on the edge, or just like the taste of Sriracha?
Finally, Android users apparently care more about what others think since they’re looking at Notes 5% more than Apple users.
For all you visual learners out there, here’s our data put together inside a pizza.
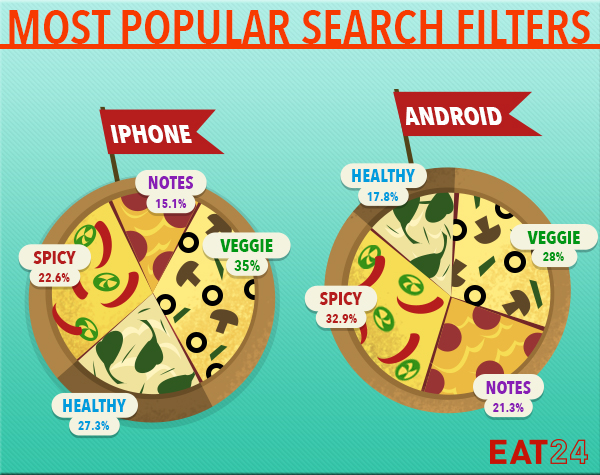
Who orders Healthier Items?
Winner: iPhone
———————————————————————————————————————–
Category #2:
Who Leaves Their Couch?
Now what about pickup orders? If people are getting up off their couches to walk a few blocks for their onion rings, they must be healthier right? Well we looked at the numbers, then we looked at potstickers, then back to numbers, and we found people were ordering pickup slightly more on iPhone. And when we say slightly we mean almost twice as often.
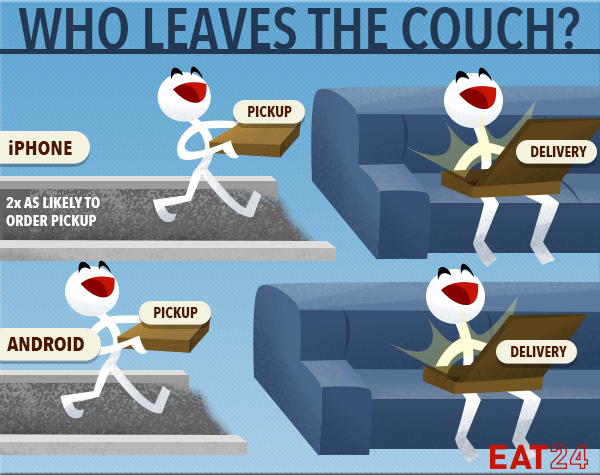
Android users prefer to have food brought to them like a badass king of the couch (respect) while iPhone users are getting up more often and burning a few calories before inhaling their meat lover’s calzone. Also, Inhaled Calzone? New band name. Called it.
Who Leaves Their Couch?
Winner: iPhone
———————————————————————————————————————–
Category #3
Logos:
Let’s take a quick look at the brand logos for each product.
On one hand we have Apple who has chosen a piece of fruit. A nice, healthy, active-lifestyle piece of fruit. Everyone loves a good apple (yes even you Braeburn).
On the other side we have a robot. Now correct us if we’re wrong but besides Wall-E, R2, Johnny 5 and maybe a handful of others, robots are pretty damn evil.
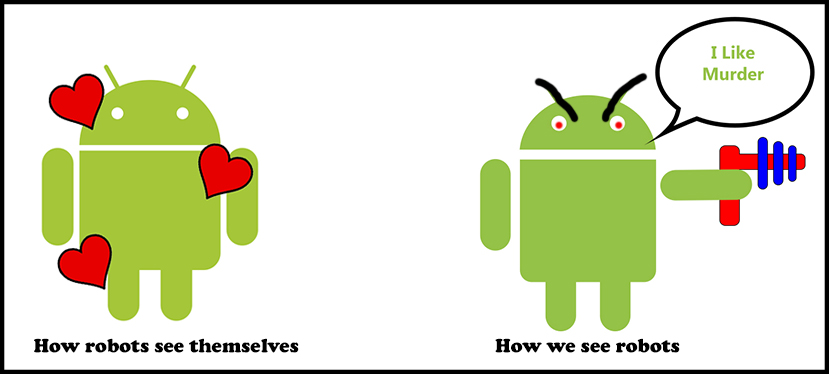
Look, when it comes to robots, here’s what we know for a fact. Robots have definitely killed way more people than apples.
Logos
Winner: Tie*
*Only to avoid a robotic-death ray
———————————————————————————————————————–
Category #4
Who has more Active/Healthier Apps?
Alright, now let’s take a look at some of the top apps available on each device, just to see if anything interesting pops up.
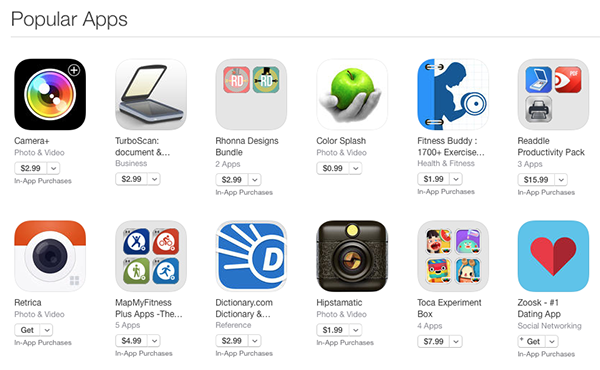
OK, we have design stuff, some artsy things, cameras, and 2 fitness apps. Plus, pre-installed and operating on all new iPhones is the Health app, which tracks how many steps you take in a given day. Moving along.
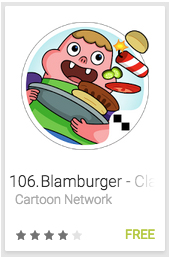
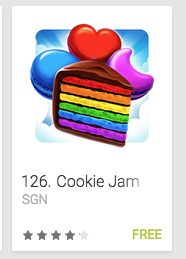
Now Android. Let’s take a look at the most popular free apps on the Google Play store.
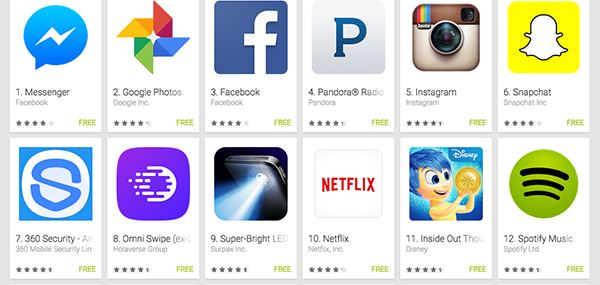
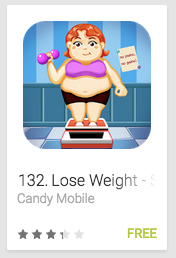
OK. Social media, free games, etc. Let’s keep scrolling until we see some sort of “health app”.

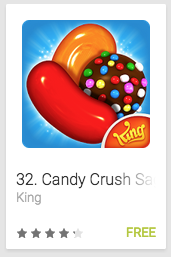

OK, whew. Finally here at #132 we finally found a fitness app.
While this might all be circumstantial (yeah, we watch lawyer shows too), there is actually quite a bit of real research showing iPhone users are generally more active and healthier than Android users. So if you want to fill up a blog with angry comments, post them here and/or here.
Who has more Active/Healthier Apps?
Winner: iPhone
———————————————————————————————————————–
Category #5
Operating Systems:
Finally we come to, quite possibly, the most significant proof that iPhone is healthier than Android. Let’s take a look at the operating systems. On the Apple front we have a nice, clean name: iOS. This probably stands for something simple, elegant and healthy.
Then we have the Android Operating system. What’re they named after? Candy and sweets. Here’s Android’s last 10 operating systems*
*Note: not ranked according to deliciousness.


ALSO JUST REALIZED THEY’RE ALL ALPHABETICAL!!!
Operating Systems:
Winner: iPhone
———————————————————————————————————————–
Overall Health Score:
iPhone: 5
Android: 1
So there you have it. Definitive proof that iPhone users are healthier than Android. And of course when we say definitive we mean probably. Of course we have equal love for people of all operating systems, so get our health-conscious app and order a pizza. Or a salad. Or a pizza salad.
Have a comment? Pro Android? Pro iPhone? Pro Blackberry? Let us know below.
I hate to break it to you and be that guy, but unless your data sets contained the exact same number of users from both operating systems, your “study” has no merit. 27% sounds like a lot but how many iOS users are we talking about? What are the exact numbers in your data set for each operating system that you are dealing with? 27% of 100,000 is a lot less than 27% of 1,000,000. You see my point?
This illustrates one of the many ways that statistics can be misrepresented to show almost anything. Not to say that there isn’t some truth to apple users making healthier choices about food.
But you gotta admit that logo data is pretty spot on.
Brace yourselves @eat24:disqus because the newest version of Android is gonna be Marshmallow. Can everyone say s’mores?
Killin’ it
We look forward to the day we can roast marshmallows using the flashlight on our phone #dreams
As long as we can agree apples are healthier to eat than robots 😉
Kay listen here Eat24, I’ll have you know that my Android phone came with a preinstalled app called S Health which looked pretty cool for the 2 minutes I browsed through it. It counts your steps, tells you the calories in your meals and you can set fitness goals! Otherwise everything in your study looks accurate (and hilarious) and I must admit I def use the delivery option more then pickup lolol
Oh Eat24, I enjoyed this article and the cute infographics, but there’s a simple mathematical error that you’ve made repeatedly. If 27% of iPhone users press healthy press healthy before anything else and only 17% of Android users do, iPhone users are not “10% more likely” to press Healthy. You’ve mixed up percentages and percentage points! It’s true that 27% is 10 percentage points higher than 17%. However, 27% is it is 59% higher than 17%. You can calculate this by using a pretty simple formula that you probably happened to forget since HS or college, the percent change formula. Or you could just edit this article to say “percentage points”.
Dude , Apple users need to eat like birds in order to fit into Their little sisters skinny jeans . Here is a joke for you , I did a study also using facts . IPhone users buy the same phone in different colors every year !
Who orders for pick up !?
They should use basis points for kicks.
This was so funny 🙂
Monsters, healthy monsters.
Awww, thank you 🙂
Ha!
do you want to watch live sex free? it is the best site -https://firecams.com: online cam sex without sms;)
We pulled sweet, sweet data from both our Android and iPhone apps looking at user ordering habits from the last few months. What we saw was interesting. Well, not “Holy cow, did that Pterodactyl just shoot lasers from its eyes?” interesting, more like “ooohhhh data” interesting. Over three months we analyzed our filters.
Developers on one side prepare their C++ based insults while the opposing side readies their taunts (your Java is so 1999!). A war is brewing and with the impending release of iPhone 6S (MORE COLORS!!!!!) the battle lines are drawn. Who will come out on top? Who will still be worth billions of dollars?? Who cares??? https://img.clippp.com/48a3544b8ec389a5da4c99238cdbf32f_students-in-a-classroom-clipart-free-download-clip-art-free-classroom-clipart_451-355.gif
Well here’s another one.
interesting, more like “ooohhhh data” interesting. Over three months we analyzed our filters.